News
How Much of Your Life Will Be on Screens in 2025? More Than Last Year, Stats Show
These are the latest stats and figures on screen time in 2025

- December 15, 2024
- Updated: July 1, 2025 at 10:37 PM

We spend an alarming average of 6 hours and 40 mins per day on screens connected to the Internet. From checking our email, watching some videos and scrolling down through social media posts to working on our desktop computers or instant messaging our family and friends, screens are part of our daily life. And while we don’t realize it, we spend approximately 42%-60% of our waking hours looking at the screen. Surprised?
In today’s article we’ll explore the latest stats and figures on screen time usage worldwide as well as sharing insights about its impact in our society.

Subscribe to the Softonic newsletter and get the latest in tech, gaming, entertainment and deals right in your inbox.
Subscribe (it's FREE) ►Top Screen Time Stats 2025
- People spend an average of 6 hours and 40 minutes on screens every day.
- The average US screen time has reached 7 hours and 3 minutes.
- 49% of 0 to 2-year-olds interact with smartphones.
- The average person spends 2 hours and 23 mins per day on social media.
- An average American checks their phone 96 times per day.
- South Africans spend an average of 9 hours and 21 minutes on screens per day (the highest number worldwide).
- 41% of teenagers spend over 8 hours on screens per day.
- Gen Z spends an average of 7 hours and 18 minutes on screens per day.
Average Screen Time Stats
The latest research from GWI shows that the average person spends 6 hours and 40 minutes connected to the Internet every day. While the screen time usage had declined by 5% during the past years, the tendency started to reverse. In fact, in 2024 the time we spent in front of a screen increased by 1% and if we compare it to 2013, it has gone up 8.4%. That’s a total of 31 minutes.
Here is a clear example to understand the magnitude of this data. If every user spends 400 minutes per day in front of a screen, the world will spend a combined total of 780 trillion minutes of screen time this year. That’s a total of 1.5 billion years!
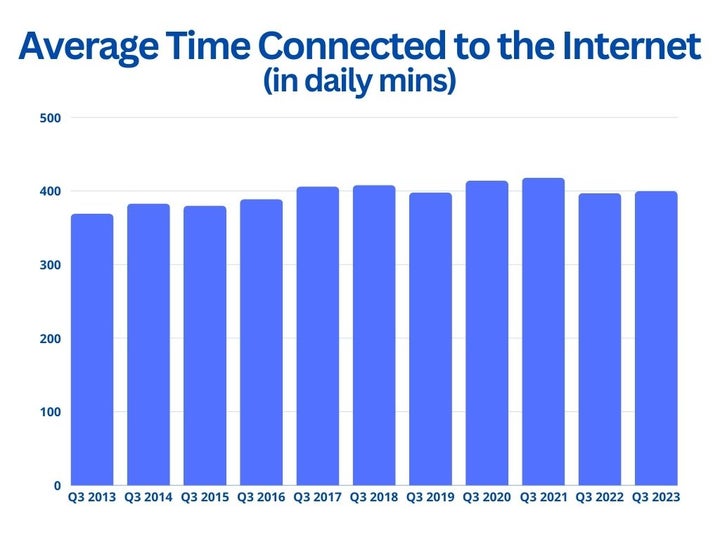
Here’s a breakdown of the average time users spend connected to the Internet since 2013:
- Q3 2013: 6 hours and 9 minutes.
- Q3 2014: 6 hours and 23 minutes.
- Q3 2015: 6 hours and 20 minutes.
- Q3 2016: 6 hours and 29 minutes.
- Q3 2017: 6 hours and 46 minutes.
- Q3 2018: 6 hours and 48 minutes.
- Q3 2019: 6 hours and 38 minutes.
- Q3 2020: 6 hours and 54 minutes.
- Q3 2021: 6 hours and 58 minutes.
- Q3 2022: 6 hours and 37 minutes.
- Q3 2023: 6 hours and 40 minutes.
On average, people spend 42% of their waking hours looking at a screen, although in countries like South Africa this figure is closer to 60%.
Average Screen Time by Country
According to a recent report made by Comparitech, South Africa leads the charts for average screen time consumption per day with 9 hours and 21 minutes. In second and third position we find Brazil and Philippines with 9 hours 12 minutes and 9 hours and 9 minutes respectively. Following close we have Argentina, with 8 hours and 40 minutes of screen time usage. Closing the top 5 we have Russia with 8 hours and 29 minutes.
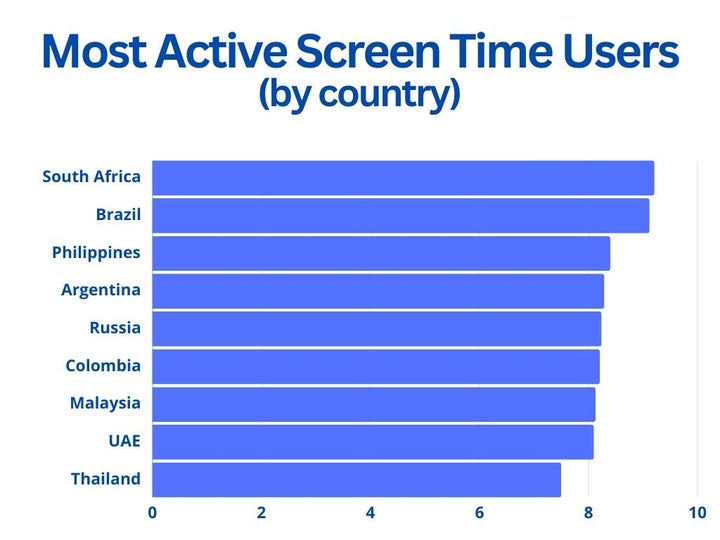
Here’s a detailed list of the 10 most active screen time users:
- South Africa- 9 hours and 21 minutes.
- Brazil- 9 hours and 12 minutes.
- Philippines- 9 hours and 9 minutes.
- Argentina- 8 hours and 40 minutes.
- Russia- 8 hours and 29 minutes.
- Colombia- 8 hours and 24 minutes.
- Chile- 8 hours and 21 minutes.
- Malaysia- 8 hours and 13 minutes.
- UAE- 8 hours and 1 minute.
- Thailand- 7 hours and 50 minutes.
(Source: Statista)
US Screen Time Stats
According to the Digital 2024: Global Overview Report and a study made by Comparitech, the average American spends 7 hours and 3 minutes in front of a screen every day. That’s 7 minutes more than the global average usage. The time is also spent equally between mobile phones and computers, having a desktop screen consumption of 3 hours and 24 minutes and a mobile one of 3 hours and 39 minutes.
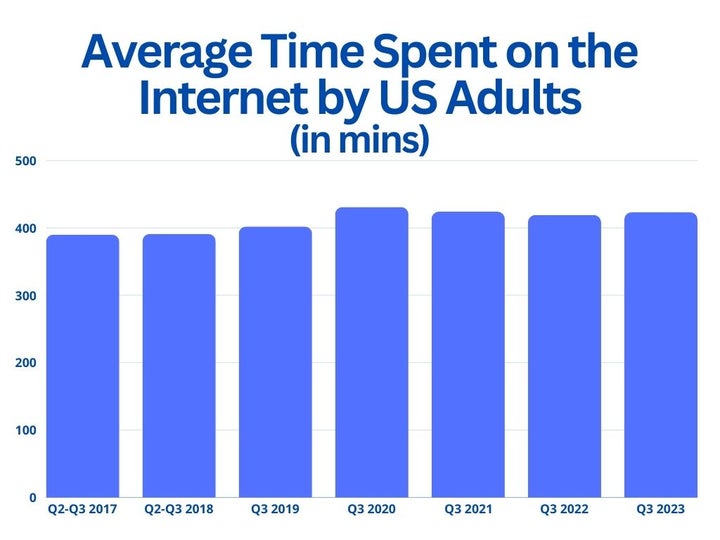
Here’s a detailed table displaying the average time spent by US adults on the Internet:
- Q2-Q3 2017- 6 hours and 30 minutes.
- Q2-Q3 2018- 6 hours and 31 minutes.
- Q3 2019- 6 hours and 42 minutes.
- Q3 2020- 7 hours and 11 minutes.
- Q3 2021- 7 hours and 4 minutes.
- Q3 2022- 6 hours and 59 minutes.
- Q3 2023- 7 hours and 3 minutes.
Regarding usage, the average US adult spends most of their screen time watching TV or playing video games. Data also shows that age plays a significant role in the amount of the screen time consumption. US teenagers lead the list of time spent with electronic devices, spending an average of 3 hours per day watching videos on them.
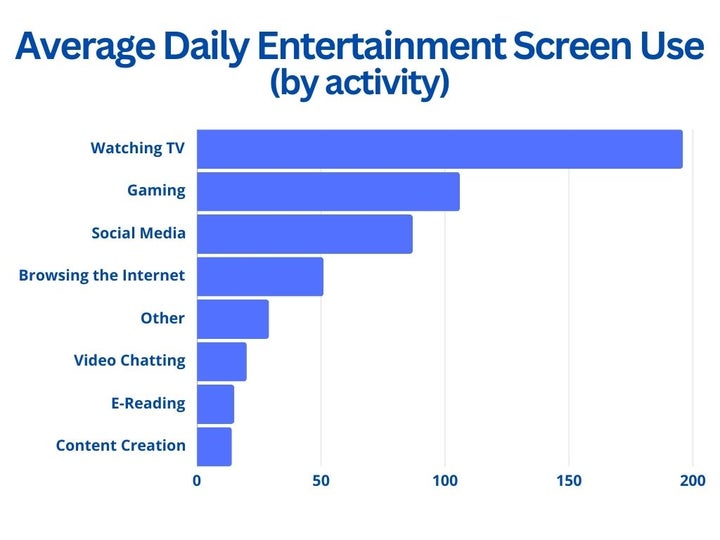
A survey made by Common Sense Media shows in which activities the average US teen distributes their screen time:
- Watching TV- 3 hours and 16 minutes.
- Gaming- 1 hour and 46 minutes.
- Social Media- 1 hours and 27 minutes.
- Browsing the Internet- 51 minutes.
- Other- 29 minutes.
- Video chatting- 20 minutes.
- E-reading- 15 minutes.
- Content creation- 14 minutes.
Income plays an important part in screen time consumption. Americans with a lower income (less than $35,000 annual income) spend an average of 9 hours and 19 minutes on their screens every day. That’s 2 hours more than the average US citizen with a higher income.
Screen Time by Age Group
According to PewResearch, around 74% of parents with children aged 2 or younger stated that their child watches TV, while 90% of older children watch it on a daily basis. This is an alarming factor, since recent studies show how being exposed to screens before the age of 6 is detrimental for the healthy development of a kid’s brain.
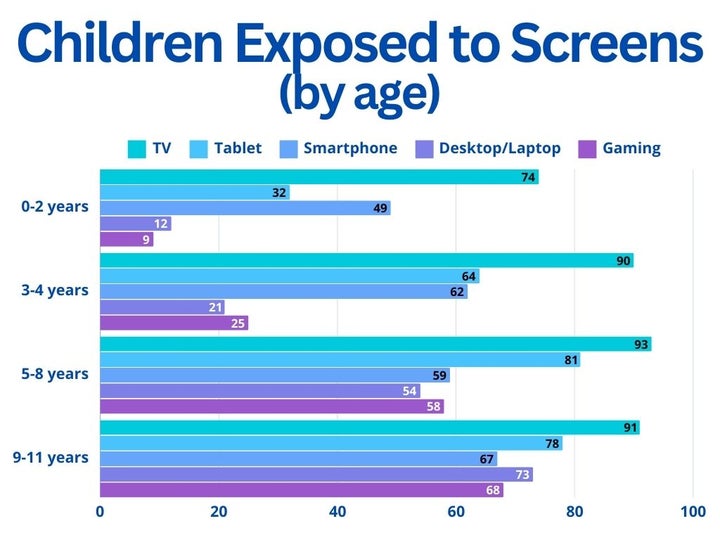
Here’s a breakdown of the proportion of children exposed to screens and their ages:
- 0-2 years: TV (74%) Tablet (32%) Smartphone (49%) Desktop/Laptop (12%) Gaming (9%)
- 3-4 years: TV (90%) Tablet (64%) Smartphone (62%) Desktop/Laptop (21%) Gaming (25%)
- 5-8 years: TV (93%) Tablet (81%) Smartphone (59%) Desktop/Laptop (54%) Gaming (58%)
- 9-11 years: TV (91%) Tablet (78%) Smartphone (67%) Desktop/Laptop (73%) Gaming (68%)
As shown by Data Reportal, Gen Z (people aged from 12-27) tend to have more screen time than older age groups. People aged 16-24 spend an average of 7 hours and 14 minutes using an Internet-connected device while people aged 55-64 spend an average of 5 hours and 15 mins in front of a screen.
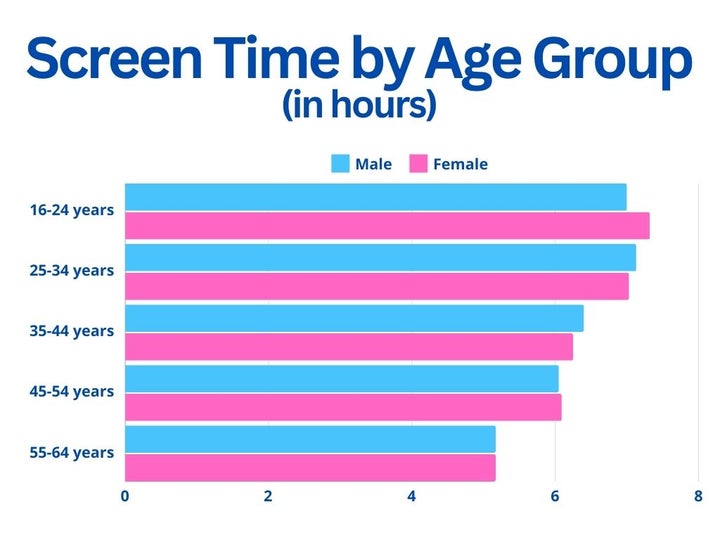
- 16-24: 7 hours and 32 minutes (female) 7 hours and 7 minutes (male)
- 25-34: 7 hours and 3 minutes (female) 7 hours and 13 minutes (male)
- 35-44: 6 hours and 25 minutes (female) 6 hours and 40 minutes (male)
- 45-54: 6 hours and 9 minutes (female) 6 hours and 5 minutes (male)
- 55-64: 5 hours and 17 minutes (female) 5 hours and 17 minutes (male)
Other studies found similar results, concluding that adults aged 18-34 spent an average of 8 hours per day using screen-based devices versus the 5 hours used by 65 years old and over.
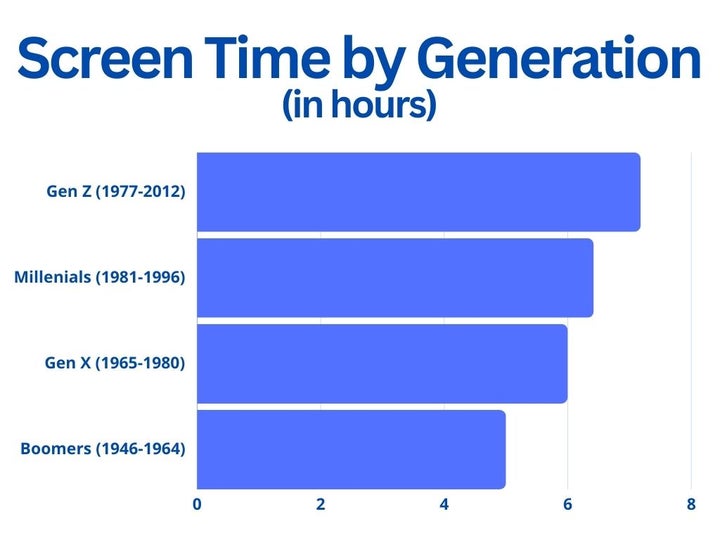
Here’s a detailed table showing the average screen time by generation:
- Gen Z (1997-2012)- 7 hours and 18 minutes.
- Millennials (1981-1996)- 6 hours and 42 minutes.
- Gen X (1965-1980)- 6 hours.
- Boomers (1946-1964)- 5 hours.
(Source: Provision Living, Demand Sage, Statista)
Social Media Screen Time Statistics
People spend an average of 2 hours and 23 minutes on social media every day, with TikTok being the preferred social media platform to spend the majority of their time.
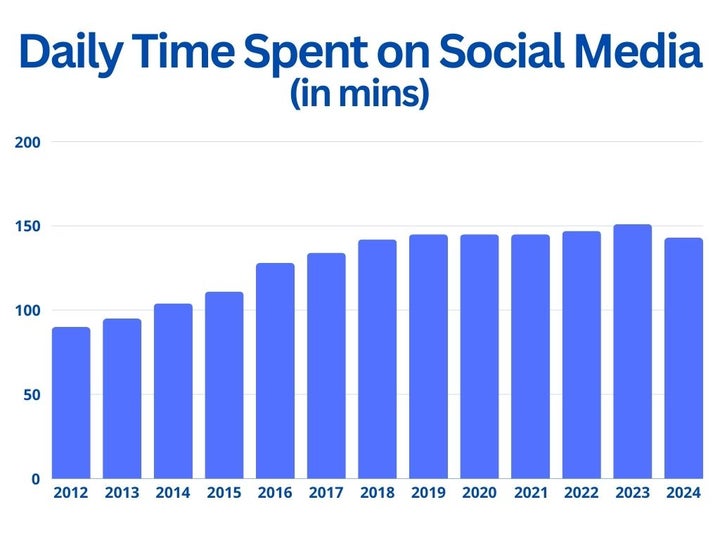
Here’s a detailed breakdown showing the daily time spent on social media worldwide.
- 2012- 1 hour and 30 minutes.
- 2013- 1 hour and 35 minutes.
- 2014- 1 hour and 44 minutes.
- 2015- 1 hour and 51 minutes.
- 2016- 2 hours and 8 minutes.
- 2017- 2 hours and 14 minutes.
- 2018- 2 hours and 22 minutes.
- 2019- 2 hours and 25 minutes.
- 2020- 2 hours and 25 minutes.
- 2021- 2 hours and 25 minutes.
- 2022- 2 hours and 27 minutes.
- 2023- 2 hours and 31 minutes.
- 2024- 2 hours and 23 minutes.
Currently, Brazil is the country with the most time spent on social media, spending an daily average of 3 hours and 49 minutes on social platforms.
Here’s the top 10 list of countries with the highest amount of time spent on social media:
- Brazil- 3 hours and 49 minutes.
- Nigeria- 3 hours and 44 minutes.
- Philippines- 3 hours and 38 minutes.
- South Africa- 3 hours and 34 minutes.
- Chile- 3 hours and 34 minutes.
- Kenya- 3 hours and 32 minutes.
- Columbia- 3 hours and 28 minutes.
- Ghana- 3 hours and 20 minutes.
- Indonesia- 3 hours and 14 minutes.
- Mexico- 3 hours and 10 minutes.
As stated above, TikTok is the preferred platform to spend time on. According to Data Reportal, users spend an average of 1 hour and 13 minutes per day watching TikTok videos, which translates into 34 hours per month spent browsing the platform. In second position we have YouTube with 54 minutes per day (28 hours and 5 minutes per month) and Facebook with 40 minutes (19 hours and 47 minutes per month).
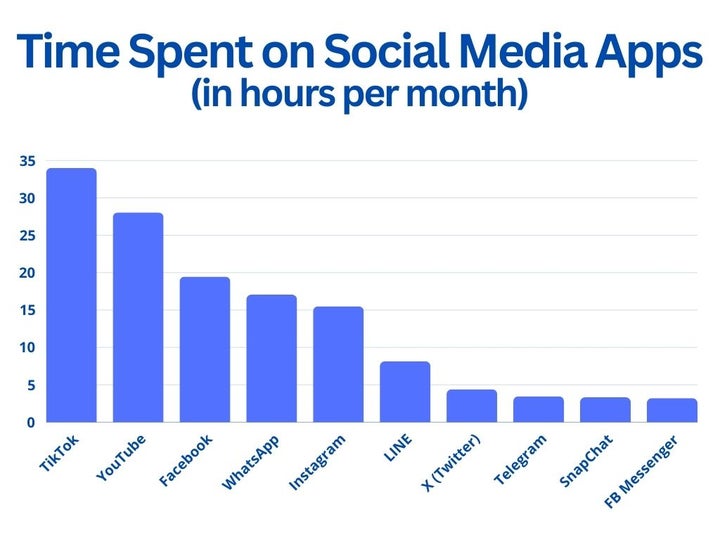
Here’s a list of the average time spent every month on social media apps:
- TikTok- 34 hours.
- YouTube- 28 hours and 5 minutes.
- Facebook- 19 hours and 47 minutes.
- WhatsApp Messenger- 17 hours and 6 minutes.
- Instagram- 15 hours and 50 minutes.
- LINE- 8 hours and 14 minutes.
- X (Twitter)- 4 hours and 40 minutes.
- Telegram- 3 hours and 45 minutes.
- SnapChat- 3 hours and 33 minutes.
- Facebook Messenger- 3 hours and 21 minutes.
Conclusion
Whether on a smartphone, desktop, tablet, PC or TV, our daily lives are linked to a screen. As seen by the data gathered, our relationship with internet-connected devices has evolved, spending more time on them as time passes. While we currently spend half of our waking hours using screens, things are definitely not set on stone. Only time will tell if our relationship with media consumption changes dramatically or if it remains the same.
Mireia Fernández is passionate about the world of video games and new technologies, a hobby that dates back to her childhood with the MSX HB 501p. Born and residing in Barcelona, Mireia has been working as an editor for over 10 years and specializes in writing reviews, tutorials, and software guides, as well as doing everything possible to publish news before anyone else. Her hobbies include spending hours playing on her console, walking her golden retriever, and keeping up with the latest SEO developments.
Latest from Mireia Fernández
- A Greener Web and Cleaner Oceans: Why So Many Are Switching to Wave Browser
- Fuel Your Instagram Feed: How Adobe Stock’s Infinite Library Powers Your Creativity
- Agentic AI in Adobe Express: Will Conversational Editing Change 2026 Content Creation?
- Gmail Help Me Write with Gemini: 7 Ready-to-Use Prompts for Complaints, Sales & Internal Memos
You may also like
 News
NewsIt is one of the most chilling games of the year, and you will soon be able to try it for free
Read more
 News
NewsValve could have to pay up to 900 million dollars for a lawsuit from the United Kingdom
Read more
 News
NewsThis Witcher RPG returns to mobile after connectivity issues
Read more
 News
NewsWe know the first details of the fourth season of Ted Lasso
Read more
 News
NewsThe most violent anime on Netflix gets a release date for its new season
Read more
 News
NewsArc Raiders receives a new update that removes one of the most hated features by players
Read more