Do you want graphics for your reports? Adobe has the best tool for you
If creating graphics is part of your profession, Adobe Illustrator might be the best tool for you.

- October 16, 2024
- Updated: October 26, 2024 at 12:41 PM
It is likely that, on many occasions, you have considered using Adobe Illustrator to create graphics or tables. However, many dismiss it almost immediately because they fear it might be complicated or difficult to learn. Nothing could be further from the truth.
Adobe Illustrator is an excellent program for creating graphics. The range of possibilities it offers, whether in shapes, styles, or colors, allows us to bring our ideas to life with great ease. If you want to know how to use Illustrator’s graphic tools, stay and learn with these simple steps.
How to Create a Chart from Scratch
In Adobe Illustrator, we have a fantastic feature dedicated exclusively to graph creation. The icon you will see by default in the toolbar is the Column Graph Tool, but if you right-click, you will see the rest of its options. If you can’t find the icon, press the J key.
- To start, select one of the chart options that appear. If you want to create a column chart, you should choose Column Graph Tool.
- Now, it’s time to define the dimension that the chart will occupy in its entirety. Click on your canvas and drag the mouse to create a square of the size you prefer.
- If you need it to have specific dimensions, click on the canvas and enter the measurements manually. Don’t worry too much; you can change the chart size at any point.
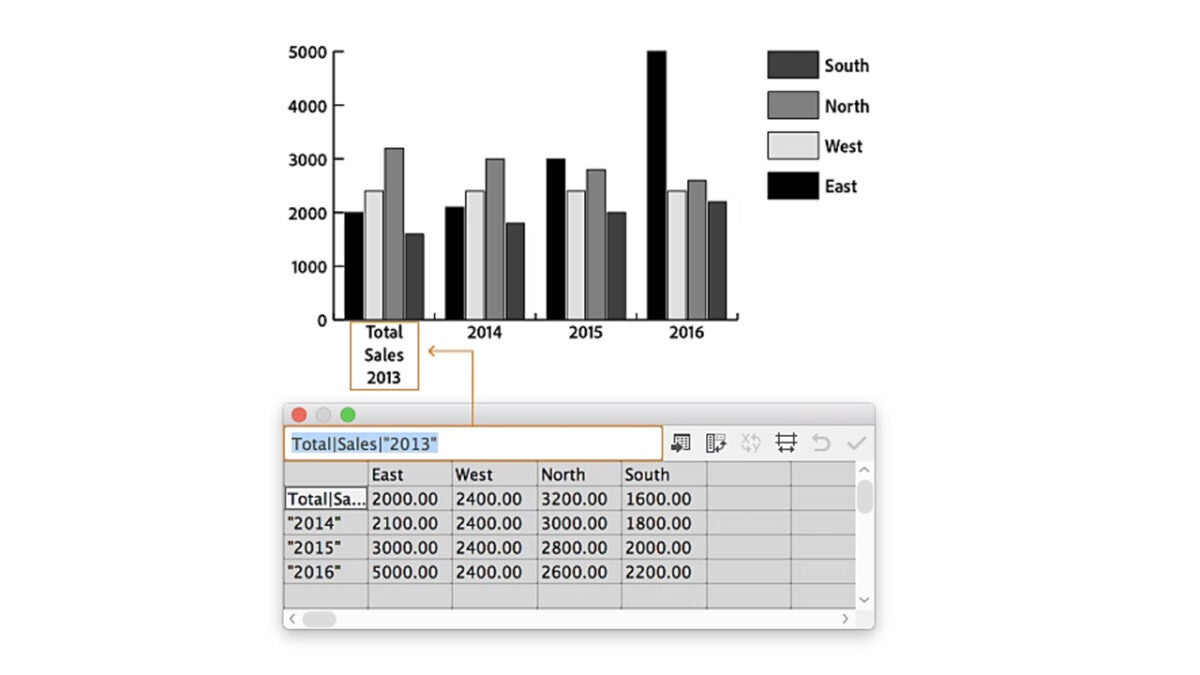
- At this point, we will need to enter the data that the chart will represent. In the first row, place the attribute. The following rows will be used to enter the numerical data. Below is an example of how you could place them and where each data would go.

- If you have the information saved in an Excel file, Illustrator will allow you to import the file so you don’t have to enter it manually.
- To adjust the width of the columns, click on the Cell Style button and enter any value between 0 and 20 within Column width (the width).
Although we have focused here on bar charts, the procedure is quite similar to other styles, such as column, line, or radar charts, among others. By following these steps, you will be able to create your chart on the first try and without major complications. Now, it’s time to make it look nice.
Customize Your Chart to the Millimeter
One of the great advantages of Adobe Illustrator is that it allows us to customize our designs to the smallest detail, and graphics are no exception. Likewise, we will start with something simpler, such as editing colors.
- Select your chart with the Selection tool (A).
- Go to Object and then select Ungroup. This will allow you to edit the individual parts that make up the chart. Be careful because once you do this, you will no longer be able to edit its data. Accept the pop-up text and select Yes to proceed.
- Once you have ungrouped the chart, you can alter its colors (and shapes too) as you wish. Select them and change them to your liking.
You can modify the size of the chart and adjust it to the space you need. To do this, you simply have to do the following:
- Select the graphic with the Selection tool (A).
- Now, follow the path and go to Object > Transform > Scale. You can also double-click on the Scale tool.
- In the contextual box that appears, enter the size you want your graphic to be.
By default, you will see that the chart legends appear on the right, but you can also change this:
- As before, select the chart with the Selection tool (A).
- Follow the path Object > Graph > Type.
- Here, click on Add Legend Across Top and press OK to finish.
Do you want to give your table a distinctive touch and add shadows? Try doing this:
- Re-select the chart with the Selection tool (A).
- Again, follow the path Object > Graph > Type.
- In the Graph Type box, click on Add Drop Shadow and select OK to finish.
Combine Different Chart Styles in One
If you have thought about mixing various styles of representation in a single graphic, you can make it a reality in Illustrator. To combine any type of graphic with another, follow these steps:
- Choose the Group Selection tool. It is located under the Direct Selection icon (key A) when you right-click.
- Now, select which data from the chart you want to change to a different style. Double-click to select both the chart and its corresponding legend.
- Follow the path Object > Graph > Type and choose which style you want to change to. Configure it to your liking so that it looks exactly as you want.
Artist by vocation and technology lover. I have liked to tinker with all kinds of gadgets for as long as I can remember.
Latest from María López
You may also like

Samsung Vs Apple: The Smartphone Battle Heats Up- And Other Compelling Stats You Can’t Miss
Read more

iOS 18.2 and ChatGPT: This is everything we can do
Read more

It's already Christmas in GTA Online: access new bonuses and gifts
Read more

Dune: Prophecy is renewed for a second season on Max
Read more

Clint Eastwood’s latest movie finally arrives on Max; why should you watch it?
Read more

The ChatGPT app is updated on Mac and PC: these are its new abilities
Read more